Support Resistance - Percentile LevelsKey Features:
1. Percentile Calculations:
The indicator calculates the 95th percentile (PercentilePlot100) and the 5th percentile (PercentilePlot5) of the high and low prices over specified lengths.
The lengths for these calculations are adjustable via input fields, allowing users to customize the periods used for percentile calculations.
2. Percentile Levels:
Resistance Levels (R1, R2, R3, R4): Plots resistance levels based on the 95th percentile of the high prices over different lengths (100, 200, 750, 4500).
Support Levels (S1, S2, S3, S4): Plots support levels based on the 5th percentile of the low prices over different lengths (100, 200, 750, 4500).
3. High-Timeframe Average:
Calculates and plots the average of the 750-period high and low percentiles (htfavg), which acts as a pivot point on the chart.
How to Use This Indicator:
1. Identify Key Support and Resistance Levels:
Use the plotted resistance (R1, R2, R3, R4) and support (S1, S2, S3, S4) levels to identify key areas where price may reverse or consolidate.
2. Pivot Point Analysis:
The plotted pivot point (htfavg) can be used to identify potential areas of trend change or consolidation. It represents the average price level based on higher timeframe percentiles.
3. Trend Analysis:
By observing how price interacts with these percentile levels, traders can gain insights into market trends and potential reversal points.
Customization:
The input fields allow you to customize the lengths of the percentiles and the percentile plot values according to your trading strategy and timeframe preference.
In summary, this indicator can help traders identify significant support and resistance levels, potential pivot points, and overall market trends based on percentile calculations of high and low prices over various periods. This can be valuable for making informed trading decisions and setting entry and exit points.
If you have any specific questions or need further customization, feel free to ask! 😊
"support resistance"に関するスクリプトを検索

Support Resistance base Volume RSIThe indicator displays support and resistance levels based on volume and the Relative Strength Index (RSI).
Variable and Input Assignment:
lookback: Determines the period for data lookback.
RsiVisible, RsilabelSize, OversoldForRsi, OverboughtForRsi: Various inputs to adjust RSI indicator parameters.
Indicator Calculation:
highestVol: Finds the highest volume within a certain period.
Rsi: Calculates the RSI value with a period of 14.
roc: Calculates the Rate of Change.
Support and Resistance Level Determination:
Uses a comparison between price change (roc) and RSI value to determine whether the price is rising or falling.
If the price is rising and the current volume is greater than the previous highest volume, a new resistance level is established.
If the price is falling and the current volume is greater than the previous highest volume, a new support level is established.
Support and Resistance Lines:
Creates lines indicating the latest support and resistance levels.
These lines are updated whenever there is a change in support or resistance levels.
RSI Labels:
Displays the RSI value above or below the price chart depending on whether the RSI is above or below the overbought or oversold levels.
If the RSI value is above the overbought level, the label is displayed above the price.
If the RSI value is below the oversold level, the label is displayed below the price.
Labels are removed if the corresponding conditions are not met.
Additional RSI Label:
Adds an additional label displaying the RSI value next to the price chart on the last bar.
The main purpose of this script is to assist traders in identifying support and resistance levels based on price movement, volume, and the RSI indicator. Thus, traders can use this information to make better trading decisions.

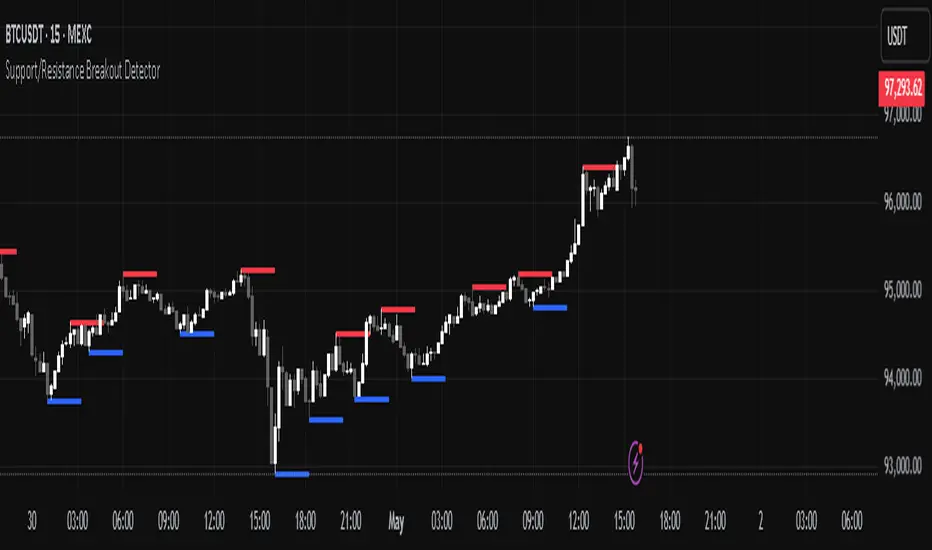
Support/Resistance Breakout DetectorThis indicator automatically detects and plots dynamic support and resistance levels using pivot highs and lows.
✅ It draws red resistance lines and blue support lines,
✅ The lines extend forward but automatically stop when the price touches them,
✅ It monitors for breakouts with strong volume,
✅ When a breakout happens, it shows labels like “B” or “Bull Wick” / “Bear Wick” on the chart,
✅ It also triggers alerts when support or resistance breaks with high volume.
Main settings:
Pivot lookback period
Show/hide breakout labels
Minimum volume for breakout
Maximum extension length for lines
This tool helps traders easily spot key price levels and watch for meaningful breakouts.
Support/Resistance LinesThis script displays support and resistance lines at the levels you enter in the Input Settings. It does not perform the S/R calculations.
It allows you to:
Enter up to 6 support and 6 resistance lines each; any with value of 0 will be hidden
Specify one ticker that it applies to, so the lines will be hidden if you switch charts
Set the text size, color, horizontal offset, and whether to display the price values for each line
Set the color, transparency and line type for the S/R lines

Support Resistance ZonesSupport and resistance zones are used across all markets by traders and bots alike to identify liquidity and possible bounce areas. This script automates the drawing of those zones based on a number of variables, such as lookback period, channel width, number of touch confirmations and more.
This script also implements a some useful alerts so you can rest easy until the market hits a point of interest:
Enter SR Zone
Exit SR Zone
Break Upper Resistance
Break Lower Resistance

Support, Resistance, MA, and ADXSummary
This comprehensive script provides traders with a tool that highlights critical levels of support and resistance, detects significant price breakouts with volume confirmation, identifies potential reversals with wick analysis, and plots a moving average that changes color based on trend strength as indicated by the ADX. It is useful for spotting entry and exit points, confirming breakouts, and identifying trend direction and strength.

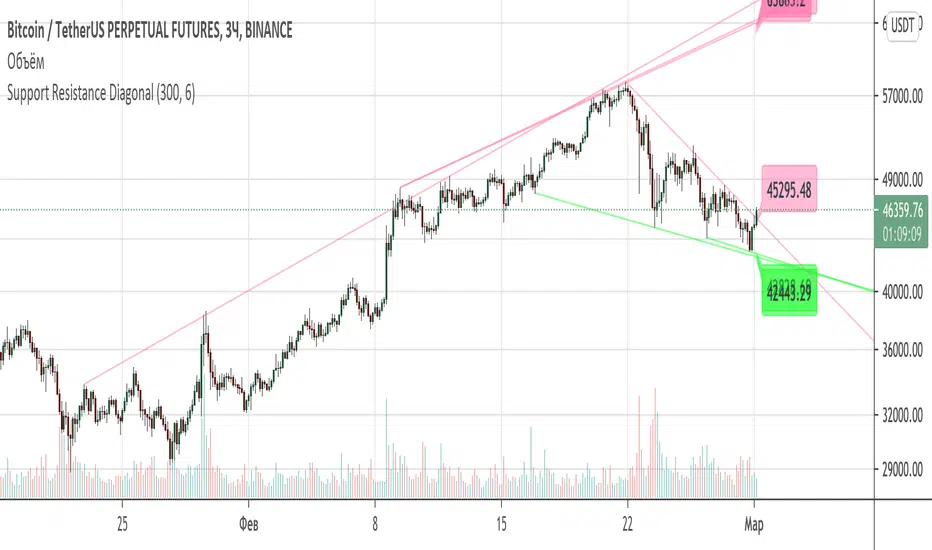
Support Resistance DiagonalClassic diagonal support and resistance based on pivot points. As a result, they form triangles, wedges, channels and other patterns. Realtime update up to 1 second chart.
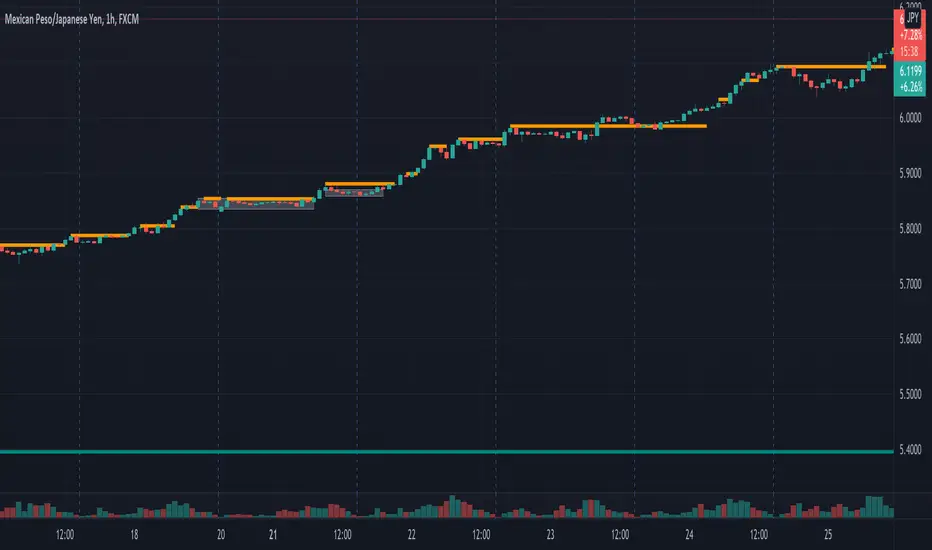
Support/Resistance x3Support and Resistance Levels for 3 time frames, based on volume at fractal levels
Original script is thanks to synapticex I have just migrated to version 3 and heavily modified it

Support/Resistance V2 IndicatorWith this support and resistance indicator, if you want more levels just change the timeframe it looks at in the settings. It will pull the SR levels off the timeframe specified in the settings. Note: SR1 and SR2 timeframe should match.
Support Resistance SD Levels Intraday OnlyYour script calculates the highest upper Bollinger Band and lowest lower Bollinger Band reached during a session. It then projects those values into the next session as horizontal levels (Previous Day High/Low based on SD). This is a solid way to identify "overextension" zones where the market historically reversed or stalled.

Support Resistance - Aging [Example]Hello All,
First all of Thanks to Pine Team for adding Arrays to Pine!
In this script I tried to make example for
1. Finding S/R lines using highest/lowest function
2. Using 1D array as 2D (we keep S/R levels and age)
3. "Age" usage for S/R levels, getting older on each candle and changing colors by their age (maximum age is 127 then it disappears)
You can use "Close"/Open " or " High/Low " as source.
There is an option for the background color, by default it's Black, do not forget to set it accordingly :)
Enjoy!


Standard Deviation Pivot pointsSupport Resistance points that are calculated based on the standard deviation of the traditional pivot point(previous session's high, low and close). More often stocks tend to oscillate between 3 levels of deviation forming day's high or low. A breakout of the 3rd SR level with volume indicates a strong trend day.

Support and Resistance (High Volume Boxes) [ChartPrime]# 📘 OPERATING MANUAL: Massive Order Spike Detector (v1.0)
## 1. PURPOSE OF THE TOOL
The **Massive Order Spike Detector** is a quantitative analysis tool designed to isolate volume anomalies. By utilizing **Standard Deviation (σ)**, it identifies the exact moments when order flow exceeds statistical norms, signaling institutional intervention ("Smart Money"), high-frequency trading (HFT) activity, or market climax events.
---
## 2. TECHNICAL SPECIFICATIONS & INPUTS
The indicator calculates the ratio between current volume and its historical volatility to define "extreme" participation.
### **Configuration Settings**
* **Volume Spike Multiplier (x σ):** *Default: **4.0***
* *Function:* Sets the sensitivity threshold. A value of 4.0 triggers a signal only if the current volume is 4 times the standard deviation of the lookback period.
* **StDev Lookback Length:** *Default: **200***
* *Function:* Defines the sample size (number of bars) used to establish the "baseline" or "normal" volume.
---
## 3. SIGNAL INTERPRETATION PROTOCOL
The indicator generates real-time visual signals on the price chart:
| Signal | Graphic Icon | Technical Condition | Market Sentiment |
| :--- | :--- | :--- | :--- |
| **Massive Buy Spike** | 🟢 Lime Triangle (Below) | Vol ≥ 4σ + Close > Open | Extreme buying pressure. Potential accumulation or aggressive breakout. |
| **Massive Sell Spike** | 🔴 Red Triangle (Above) | Vol ≥ 4σ + Close < Open | Extreme selling pressure. Potential distribution or panic selling. |
---
## 4. OPERATIONAL PROCEDURES (STRATEGIES)
### **A. Breakout Validation (Trend Following)**
* **Context:** Price is testing a key Support/Resistance or a consolidation zone.
* **Trigger:** A Spike appears (Lime for Long / Red for Short) as the level is breached.
* **Execution:** The signal confirms that institutional volume is backing the move. High probability of trend continuation.
### **B. Exhaustion Climax (Mean Reversion)**
* **Context:** Price is in an extended trend (overbought/oversold).
* **Trigger:** A Spike appears in the direction of the trend, but the candle features a long wick (rejection) or a small body.
* **Execution:** This indicates a "Blow-off Top" or "Selling Climax." Traders should look to take profits or prepare for a reversal once market structure shifts.
---
## 5. ALERT MANAGEMENT
To ensure no institutional moves are missed, follow this setup for TradingView notifications:
1. Open the **"Create Alert"** panel in TradingView.
2. Select **"Massive Order Spike Detector"** as the condition.
3. Set frequency to: **"Once Per Bar Close"** (to prevent false triggers during mid-candle volatility).
4. The automated message includes the **Normalized Volume** value to gauge the magnitude of the spike.
---
## 6. RISK WARNINGS & BEST PRACTICES
⚠️ **Macro Events:** During high-impact news (e.g., NFP, CPI), spikes are common but highly volatile. Use wider stop losses or avoid entry during the first 5 minutes.
⚠️ **Low Liquidity Assets:** On "thin" charts, a 4.0 multiplier may trigger too often. Increase the multiplier to **6.0+** for better accuracy.
⚠️ **Confluence:** Never trade a spike in isolation. Always align signals with Price Action (Support/Resistance) or Trend Filters (e.g., 200 EMA).

DTG Open Range Breakout
Description:
Overview The Open Range Breakout (ORB) is one of the most statistically significant strategies for day traders, particularly in Futures (ES/NQ) and Forex markets. This indicator automates the process of identifying the "Opening Range" (e.g., the first 30 minutes of the New York session) and visualizing the key High/Low levels that define the day's bias.
Unlike standard indicators that clutter the chart, this tool focuses on Price Action context. It highlights the critical volatility window and alerts you only when price makes a definitive move outside of this established range.
Key Features
Fully Customizable Session: Defaults to 09:30–10:00 (ET), but can be adjusted for any market (London Open, Tokyo Open, etc.).
Visual "No-Trade" Zone: Draws a shaded box representing the range formation period. This helps traders avoid "choppy" price action during the initial volatility.
Auto-Reset: The script automatically detects a new trading day and resets the range, keeping your chart clean without manual intervention.
Dynamic Support/Resistance: Once the range is closed, the High and Low lines extend forward, acting as key support or resistance levels for the rest of the session.
Smart Alerts: Alerts are programmed to trigger only after the range has fully formed, preventing false signals during the volatility establishment phase.
Reversals: If price breaks out but immediately fails and re-enters the box, consider this a "Fakeout" and look for a move to the opposite side.
Settings
Open Range Session: The specific time window to measure (Format: HHMM-HHMM).
Range Box Color: Visual preference for the shaded area.
Extend High/Low Lines: Toggle the dashed projection lines on/off.
DON.TRADES.GOLD@GMAIL.COM
Disclaimer This script is for educational and analytical purposes only. Past performance of a breakout strategy does not guarantee future results. Always manage risk.

EMA Trend Reversal (Regime Change)
EMA Trend Reversal (Regime Change)
This indicator highlights EMA slope reversals that often coincide with trend or regime shifts, using a simple two-stage visual system.
It is especially effective on higher timeframes (Daily / Weekly) for swing trading and trend-bias awareness.
Detailed User Guide
What the signals mean
Unconfirmed signals (triangles)
Yellow triangle below price
- EMA is turning up intrabar (not yet confirmed)
Yellow triangle above price
- EMA is turning down intrabar (not yet confirmed)
Unconfirmed signals may repeat at a set interval until confirmation.
Confirmed signals (dots)
Green dot below price
- EMA slope has confirmed upward (bullish regime shift)
Red dot above price
- EMA slope has confirmed downward (bearish regime shift)
Confirmed dots only appear after the candle closes.
Alerts
This script provides two alerts only:
EMA Reversal UP
EMA Reversal DOWN
Each alert can fire on:
Initial unconfirmed reversal
Reminder interval while unconfirmed
Final confirmed reversal
Alerts will NOT fire unless this indicator is active on at least one chart.
It may be kept on a chart you do not actively trade.
Settings
EMA Length (default: 21)
Reminder interval (minutes)
Show / hide unconfirmed triangles
Show / hide confirmed dots
Dot transparency
Colors (locked to preserve signal meaning)
Best use cases
Identifying trend or regime changes
Weekly swing trade entries and exits
Holding-period guidance during trends
Alert-based monitoring without watching charts
This is not a scalp or oscillator signal.
It works best when combined with structure, support/resistance, or higher-timeframe context.
Disclaimer
This indicator is provided for educational and informational purposes only.
It does not constitute financial, investment, or trading advice.
All trading involves risk. Use at your own discretion.

GoldenZoneORBTOS Draws High/Low of Opening 15 Minutes of the day and then adds in Key Fib levels off that range with a middle golden zone for retracement/support/resistance based on ORB. Works well combined with other indicators like Anchored VWAP

EMA Trend Reversal (Regime Change)EMA Trend Reversal (Regime Change)
This indicator highlights EMA slope reversals that often coincide with trend or regime shifts, using a simple two-stage visual system.
It is especially effective on higher timeframes (Daily / Weekly) for swing trading and trend-bias awareness.
Detailed User Guide
What the signals mean
Confirmed signals (dots)
Green dot below price
- EMA slope has confirmed upward (bullish regime shift)
Red dot above price
- EMA slope has confirmed downward (bearish regime shift)
Confirmed dots only appear after the candle closes.
Unconfirmed signals (triangles)
Yellow triangle below price
- EMA is turning up intrabar (not yet confirmed)
Yellow triangle above price
- EMA is turning down intrabar (not yet confirmed)
Unconfirmed signals may repeat at a set interval until confirmation.
Alerts
This script provides two alerts:
EMA Reversal UP
EMA Reversal DOWN
Each alert can fire on:
Initial unconfirmed reversal
Reminder interval while unconfirmed
Final confirmed reversal
Alerts will NOT fire unless this indicator is active on at least one chart.
It may be kept on a chart you do not actively trade.
Settings
EMA Length (default: 21)
Reminder interval (minutes)
Show / hide unconfirmed triangles
Show / hide confirmed dots
Dot transparency
Colors (locked to preserve signal meaning)
Best use cases
Identifying trend or regime changes
Weekly swing trade entries and exits
Holding-period guidance during trends
Alert-based monitoring without watching charts
This is not a scalp or oscillator signal.
It works best when combined with structure, support/resistance, or higher-timeframe context.
Disclaimer
This indicator is provided for educational and informational purposes only.
It does not constitute financial, investment, or trading advice.
All trading involves risk. Use at your own discretion.

Daily/Weekly FVG by KrisThis indicator is a Multi-Timeframe (MTF) tool designed to automatically identify and project Fair Value Gaps (Imbalances) from Daily and Weekly timeframes onto your current chart. It helps traders locate higher-timeframe Areas of Interest (POI) and liquidity voids without manually switching charts.
How it works:
The script utilizes `request.security` to fetch High and Low data from Daily and Weekly timeframes. It identifies a Fair Value Gap (FVG) based on the 3-candle formation logic where price moves inefficiently, leaving a gap between the wicks.
- Bullish FVG: Identified when the current Daily/Weekly Low is greater than the High of the candle from 2 periods ago.
- Bearish FVG: Identified when the current Daily/Weekly High is lower than the Low of the candle from 2 periods ago.
The indicator draws a box extending to the right to visualize the zone, along with a dotted midline which often acts as a sensitive support/resistance level.
Unique Feature: Smart Mitigation (Auto-Hide)
To keep your chart clean and focused on relevant data, the script includes a "Full Fill" logic. It continuously monitors price action relative to existing FVG boxes.
- If price completely crosses through a box (fully fills the gap), the indicator considers it "mitigated" and automatically hides the box and its midline (sets transparency to 100%).
- This ensures you only see "fresh" or unfilled gaps that are still relevant for trading.
Settings:
- TF Checkboxes (Daily/Weekly FVG): Toggle the visibility of Daily or Weekly gaps independently based on your analysis needs.
- Design Mode:
Colored: Uses classic Green (Bullish) and Red (Bearish) colors for easy trend identification.
Monochrome: Uses Gray tones for a minimalist look that reduces visual noise on the chart.
Usage:
Use these zones to identify potential reversal points or liquidity targets. Since these are higher-timeframe levels, they often carry more weight than intraday imbalances.

EMA Slope + Pullback Pro IndicatorEMA Slope + Pullback Pro Indicator
Core: EMA trend analysis with automated pullback detection.
Key Features:
3-EMA Slope System (9,20,50) with trend signals
Smart Pullback Monitor with visual alerts
Complete Data Table showing all metrics
Multi-Filter System (timeframe + volume)
What It Does:
Shows EMA trends and strength
Detects price pullbacks to EMA levels
Gives entry signals at EMA support/resistance
Filters signals with higher timeframe trend
Visual:
EMA lines on chart
Pullback zones (colored)
Entry arrows
Data table with live metrics
For: Trend + pullback traders wanting automated EMA analysis.

Support and Resistance ZoneSupport and Resistance Zone Indicator :
Introduction :
The purpose of this indicator is to identify the chart symbol's main supports and resistances. It displays these key zones, which are very important psychological points for traders. Since support and resistance are not very precise levels, the indicator displays them as zones.
Pivots :
Pivots are a key concept in identifying support and resistance. The indicator uses two types of pivot:
Pivot high : This is a high point that has not been reached by a user-defined number of candles on either the left and right of this candle. The " left pivot leg " is the number of candles before this pivot point that have not reached the realized high, and the " right pivot leg " is the number of candles after this pivot point that have not reached this high. If these two conditions are met, the pivot point is considered a turning point, and resistance is probably the cause.
Pivot low : This is a low point that has not been reached by a user-defined number of candles on either the left or right. The " left pivot leg " is the number of candles before this pivot point that have not reached the candle low, and the " right pivot leg " is the number of candles after this pivot point that have not reached this low. If these two conditions are met, the pivot point is considered a turning point, and support is probably the cause.
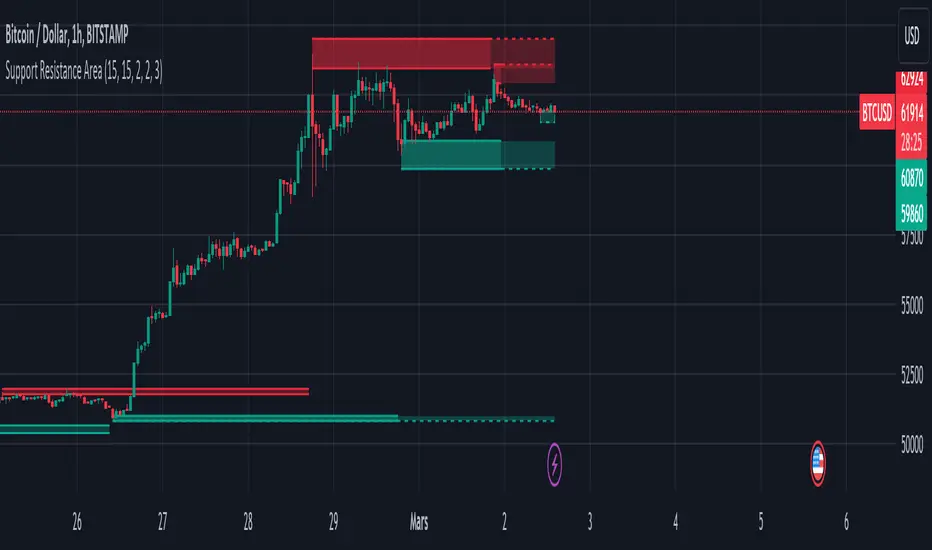
Support/Resistance area :
If a pivot point has been identified, the indicator considers it a resistance if it's a pivot high, or a support if it's a pivot low. To define the support or resistance zone, we'll use the ATR (Average True Range), an indicator that measures asset volatility. We'll take the ATR of the candle for which the pivot was spotted, and use it as the width of the support or resistance zone. Thus the upper line of support/resistance is at pivot+atr/2 and the lower line is at pivot-atr/2 . The greater the volatility, the larger the zone.
New Support/Resistance :
If a new pivot has been identified, but the level of this pivot lies between the lower line and the upper line of the previous support or resistance, the indicator considers this to be the same support or resistance as before. In this case, no new support or resistance is created. The pivot must be outside the area of the previous support or resistance to be validated.
Anticipated Support/Resistance :
This indicator also allows early detection of support or resistance. To do this, the value of the right pivot legs will be shortened in order to find these areas more quickly. The support or resistance will then be considered anticipated and may disappear at any time if the high/low is reached. On the other hand, if the high/low is not reached, and a number of candles equal to the " Right Pivot Legs" parameter has elapsed since the detection of this anticipated support/resistance, it will be considered validated and will integrate the other supports/resistances of the chart.
Extended supports/resistances :
For a more optimal view, the indicator allows the user to choose the number of last support or resistance levels to be extended to the last candle. This must be specified in the indicator parameters.
Parameters :
Pivot Legs : Determine the left and right legs of the pivot i.e the number of candle before and after the pivot that doesn’t reach pivot point. The pivot is validated only if this two conditions are verified.
Extend Last Supports : Number of supports to extend to the last bar
Extend Last Resistances : Number of resistances to extend to the last bar
Show Support/Resistance Anticipated : If yes, will find anticipated support and resistance
Right Pivot Legs for Anticipation : Determine the right legs of pivots to find faster a support or a resistance.
Conclusion :
This indicator plot support and resistance zones based on pivot. The width of support and resistance zones are calculated with ATR. Possibility to find anticipated support and resistance in order to have more timeliness informations.
Enjoy the indicator and don’t forget to take the trade ;)
Adaptive MFT Extremum Pivots [Elysian_Mind]Adaptive MFT Extremum Pivots
Overview:
The Adaptive MFT Extremum Pivots indicator, developed by Elysian_Mind, is a powerful Pine Script tool that dynamically displays key market levels, including Monthly Highs/Lows, Weekly Extremums, Pivot Points, and dynamic Resistances/Supports. The term "dynamic" emphasizes the adaptive nature of the calculated levels, ensuring they reflect real-time market conditions. I thank Zandalin for the excellent table design.
---
Chart Explanation:
The table, a visual output of the script, is conveniently positioned in the bottom right corner of the screen, showcasing the indicator's dynamic results. The configuration block, elucidated in the documentation, empowers users to customize the display position. The default placement is at the bottom right, exemplified in the accompanying chart.
The deliberate design ensures that the table does not obscure the candlesticks, with traders commonly situating it outside the candle area. However, the flexibility exists to overlay the table onto the candles. Thanks to transparent cells, the underlying chart remains visible even with the table displayed atop.
In the initial column of the table, users will find labels for the monthly high and low, accompanied by their respective numerical values. The default precision for these values is set at #.###, yet this can be adjusted within the configuration block to suit markets with varying degrees of volatility.
Mirroring this layout, the last column of the table presents the weekly high and low data. This arrangement is part of the upper half of the table. Transitioning to the lower half, users encounter the resistance levels in the first column and the support levels in the last column.
At the center of the table, prominently displayed, is the monthly pivot point. For a comprehensive understanding of the calculations governing these values, users can refer to the documentation. Importantly, users retain the freedom to modify these mathematical calculations, with the table seamlessly updating to reflect any adjustments made.
Noteworthy is the table's persistence; it continues to display reliably even if users choose to customize the mathematical calculations, providing a consistent and adaptable tool for informed decision-making in trading.
This detailed breakdown offers traders a clear guide to interpreting the information presented by the table, ensuring optimal use and understanding of the Adaptive MFT Extremum Pivots indicator.
---
Usage:
Table Layout:
The table is a crucial component of this indicator, providing a structured representation of various market levels. Color-coded cells enhance readability, with blue indicating key levels and a semi-transparent background to maintain chart visibility.
1. Utilizing a Table for Enhanced Visibility:
In presenting this wealth of information, the indicator employs a table format beneath the chart. The use of a table is deliberate and offers several advantages:
2. Structured Organization:
The table organizes the diverse data into a structured format, enhancing clarity and making it easier for traders to locate specific information.
3. Concise Presentation:
A table allows for the concise presentation of multiple data points without cluttering the main chart. Traders can quickly reference key levels without distraction.
4. Dynamic Visibility:
As the market dynamically evolves, the table seamlessly updates in real-time, ensuring that the most relevant information is readily visible without obstructing the candlestick chart.
5. Color Coding for Readability:
Color-coded cells in the table not only add visual appeal but also serve a functional purpose by improving readability. Key levels are easily distinguishable, contributing to efficient analysis.
Data Values:
Numerical values for each level are displayed in their respective cells, with precision defined by the iPrecision configuration parameter.
Configuration:
// User configuration: You can modify this part without code understanding
// Table location configuration
// Position: Table
const string iPosition = position.bottom_right
// Width: Table borders
const int iBorderWidth = 1
// Color configuration
// Color: Borders
const color iBorderColor = color.new(color.white, 75)
// Color: Table background
const color iTableColor = color.new(#2B2A29, 25)
// Color: Title cell background
const color iTitleCellColor = color.new(#171F54, 0)
// Color: Characters
const color iCharColor = color.white
// Color: Data cell background
const color iDataCellColor = color.new(#25456E, 0)
// Precision: Numerical data
const int iPrecision = 3
// End of configuration
The code includes a configuration block where users can customize the following parameters:
Precision of Numerical Table Data (iPrecision):
// Precision: Numerical data
const int iPrecision = 3
This parameter (iPrecision) sets the precision of the numerical values displayed in the table. The default value is 3, displaying numbers in #.### format.
Position of the Table (iPosition):
// Position: Table
const string iPosition = position.bottom_right
This parameter (iPosition) sets the position of the table on the chart. The default is position.bottom_right.
Color preferences
Table borders (iBorderColor):
// Color: Borders
const color iBorderColor = color.new(color.white, 75)
This parameters (iBorderColor) sets the color of the borders everywhere within the window.
Table Background (iTableColor):
// Color: Table background
const color iTableColor = color.new(#2B2A29, 25)
This is the background color of the table. If you've got cells without custom background color, this color will be their background.
Title Cell Background (iTitleCellColor):
// Color: Title cell background
const color iTitleCellColor = color.new(#171F54, 0)
This is the background color the title cells. You can set the background of data cells and text color elsewhere.
Text (iCharColor):
// Color: Characters
const color iCharColor = color.white
This is the color of the text - titles and data - within the table window. If you change any of the background colors, you might want to change this parameter to ensure visibility.
Data Cell Background: (iDataCellColor):
// Color: Data cell background
const color iDataCellColor = color.new(#25456E, 0)
The data cells have a background color to differ from title cells. You can configure this is a different parameter (iDataColor). You might even set the same color for data as for the titles if you will.
---
Mathematical Background:
Monthly and Weekly Extremums:
The indicator calculates the High (H) and Low (L) of the previous month and week, ensuring accurate representation of these key levels.
Standard Monthly Pivot Point:
The standard pivot point is determined based on the previous month's data using the formula:
PivotPoint = (PrevMonthHigh + PrevMonthLow + Close ) / 3
Monthly Pivot Points (R1, R2, R3, S1, S2, S3):
Additional pivot points are calculated for Resistances (R) and Supports (S) using the monthly data:
R1 = 2 * PivotPoint - PrevMonthLow
S1 = 2 * PivotPoint - PrevMonthHigh
R2 = PivotPoint + (PrevMonthHigh - PrevMonthLow)
S2 = PivotPoint - (PrevMonthHigh - PrevMonthLow)
R3 = PrevMonthHigh + 2 * (PivotPoint - PrevMonthLow)
S3 = PrevMonthLow - 2 * (PrevMonthHigh - PivotPoint)
---
Code Explanation and Interpretation:
The table displayed beneath the chart provides the following information:
Monthly Extremums:
(H) High of the previous month
(L) Low of the previous month
// Function to get the high and low of the previous month
getPrevMonthHighLow() =>
var float prevMonthHigh = na
var float prevMonthLow = na
monthChanged = month(time) != month(time )
if (monthChanged)
prevMonthHigh := high
prevMonthLow := low
Weekly Extremums:
(H) High of the previous week
(L) Low of the previous week
// Function to get the high and low of the previous week
getPrevWeekHighLow() =>
var float prevWeekHigh = na
var float prevWeekLow = na
weekChanged = weekofyear(time) != weekofyear(time )
if (weekChanged)
prevWeekHigh := high
prevWeekLow := low
Monthly Pivots:
Pivot: Standard pivot point based on the previous month's data
// Function to calculate the standard pivot point based on the previous month's data
getStandardPivotPoint() =>
= getPrevMonthHighLow()
pivotPoint = (prevMonthHigh + prevMonthLow + close ) / 3
Resistances:
R3, R2, R1: Monthly resistance levels
// Function to calculate additional pivot points based on the monthly data
getMonthlyPivotPoints() =>
= getPrevMonthHighLow()
pivotPoint = (prevMonthHigh + prevMonthLow + close ) / 3
r1 = (2 * pivotPoint) - prevMonthLow
s1 = (2 * pivotPoint) - prevMonthHigh
r2 = pivotPoint + (prevMonthHigh - prevMonthLow)
s2 = pivotPoint - (prevMonthHigh - prevMonthLow)
r3 = prevMonthHigh + 2 * (pivotPoint - prevMonthLow)
s3 = prevMonthLow - 2 * (prevMonthHigh - pivotPoint)
Initializing and Populating the Table:
The myTable variable initializes the table with a blue background, and subsequent table.cell functions populate the table with headers and data.
// Initialize the table with adjusted bgcolor
var myTable = table.new(position = iPosition, columns = 5, rows = 10, bgcolor = color.new(color.blue, 90), border_width = 1, border_color = color.new(color.blue, 70))
Dynamic Data Population:
Data is dynamically populated in the table using the calculated values for Monthly Extremums, Weekly Extremums, Monthly Pivot Points, Resistances, and Supports.
// Add rows dynamically with data
= getPrevMonthHighLow()
= getPrevWeekHighLow()
= getMonthlyPivotPoints()
---
Conclusion:
The Adaptive MFT Extremum Pivots indicator offers traders a detailed and clear representation of critical market levels, empowering them to make informed decisions. However, users should carefully analyze the market and consider their individual risk tolerance before making any trading decisions. The indicator's disclaimer emphasizes that it is not investment advice, and the author and script provider are not responsible for any financial losses incurred.
---
Disclaimer:
This indicator is not investment advice. Trading decisions should be made based on a careful analysis of the market and individual risk tolerance. The author and script provider are not responsible for any financial losses incurred.
Kind regards,
Ely

[RickAtw] O1 Opening Market LineThis indicator helps to identify current support and resistance based on the opening of the Asian, London and New York sessions.
Function
You can make good trade entries based on these lines. Shows daily and weekly openings of each session
It will also help you to look at which session you are currently trading)
Purple ----> Asian session
Red ----> London session
Blue ----> New York session
Key Signal
buy ---> A strong buy signal is a bounce from the low and the presence of a weekly or day open line.
sell ---> A strong sell signal is a bounce from the maximum and the presence of a weekly or day open line.
P.S. Be sure to test on your pair!
Remarks
This will help you determine the approximate area of support and resistance.
Since we cannot look into the future, it does not inform you about the exact records, but a possible change in trends.
Readme
In real life, I am a professional investor. And I check each of my indicators on my portfolio and how effective it is. I will not post a non-working method. The main thing is to wait for the beginning of trends and make money!
I would be grateful if you subscribe ❤️
